How poly-pipe squares help assess land ‘bio-condition’ over time
")
What’s the deal with the square?
You’ll often see our field team carrying these large poly-pipe squares on property.
And they’re not just thinking outside the square – these contraptions are used to measure land condition over time.
Known as ‘biocondition assessments’, this monitoring tool plays a important role in capturing changes in NRM condition for several projects in the DCQ region.
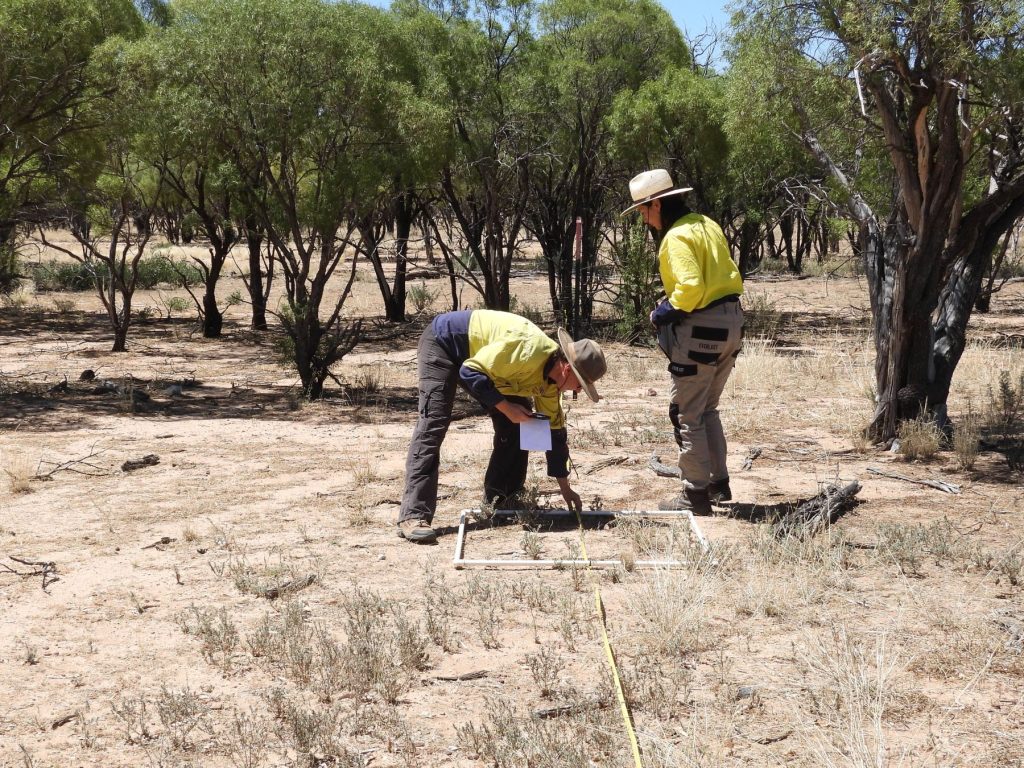
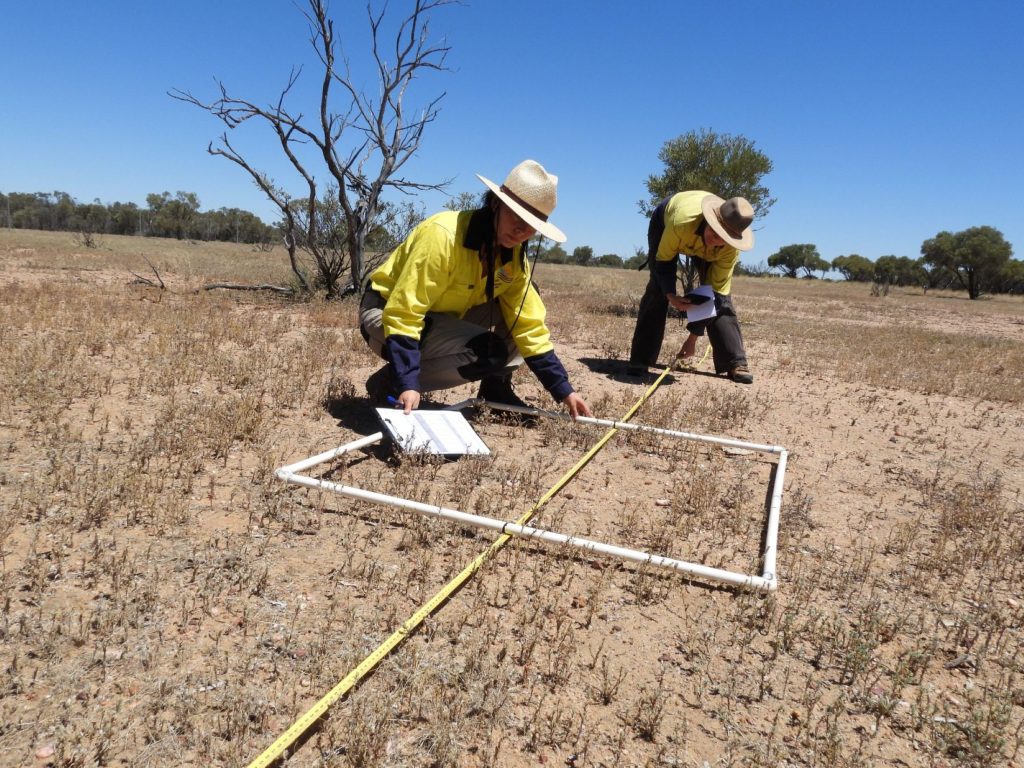
DCQ staff set up a transect (yellow tape measure) amidst trees and shrubs near Darr River, 5 November 2025. (Photo by Crispian Yeomans)
How it works
We’ll explain it with a few monitoring sites from our cactus project.
Firstly, DCQ staff will look for some suitable sites to conduct long-term monitoring.
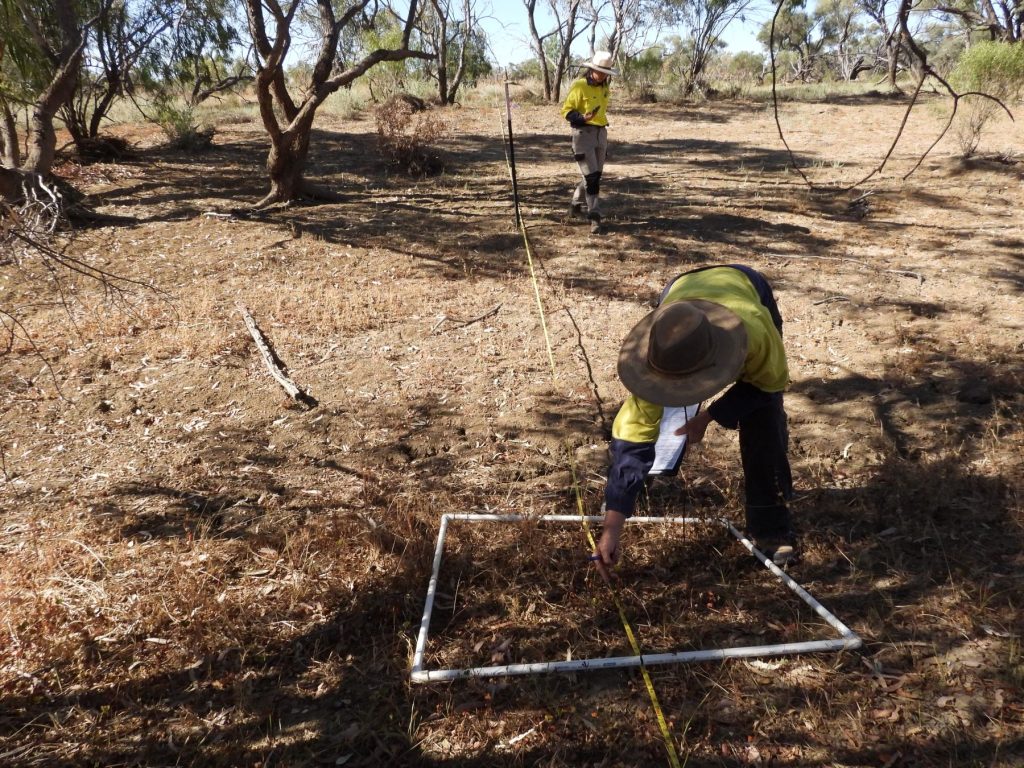
It’s a team effort to set up a biocondition assessment, 5 November 2025. (Photo by Crispian Yeomans)
Staff will usually select sites near a specific project location (e.g. a cactus infestation), as well as a couple of sites a short distance away as a ‘baseline’.
The monitoring sites near projects allow us to assess the change over time due to project work (e.g. weed spraying, spelling, fencing, erosion mitigation), while baselines allow us to isolate seasonal factors (e.g. rainfall, heat) and ensure rigour in our results.
At the end of every wet season (April – June) and dry season (October – December) for the next three or so years, our teams will return to the same site to conduct a biocondition assessment with these poly squares.
Read the transcript
JANA SYKOROVA, DCQ: Forty-five!
MARIA VEGA, DCQ: Forty!
JANA: So how we do it is in those one-by-one metre quadrats, we’re going to see what’s the percentage of the perennial grasses, annual forbs, shrubs, non-native grasses, litter, rock, bare ground and that’s biocrust.
Look, this your 50 per cent. If you go down through line, so you go 25 per cent here and then you split it into smaller quadrats, and then you try to visualise. If we put all the, let’s say, perennial grasses into the corner, would it fill 25 per cent or you know 12.5 per cent or?
So this is how we’re trying to judge what’s the percentage.
MARIA: So all of this is biocrust. All of that…
JANA: Okay yeah, go ten. Yeah. And the rest is bare ground.
So all the elements you count, they all together have to come to 100 per cent. And if you’re not sure, you look at back at it and let’s say you end up with bare ground 60 per cent, and then you look at it again and say, “Oh, it doesn’t really reflect the truth, so then you go back to your other scores and see if you can adjust them.”
CRISPIAN YEOMANS, Host: So, in this particular square, it doesn’t look like there’s that much going on because you can see most of the underlying sandy soil. Is that true? Is there a lot going on in this square, or is it quite bare?
MARIA: All of those annual grasses that are dead now count as litter. So you look and yeah it’s dead, but that is not completely bare ground because we consider that litter. Because it can degrade and come back to the ground.
JANA: Yeah, plus then you have the biocrust, so you look at it and if you would look at it you would think “Oh that’s bare ground, this one.” But this is actually biocrust cover, so we don’t count it into the bare ground.
CRISPIAN: So there’s actually quite a lot going on in this particular quadrat?
JANA: It is.
CRISPIAN: More than you’d think on the first look?
JANA: Yes, definitely. That’s always the case.
CRISPIAN: This mixture of measuring tapes and poly-pipe squares are what we call biocondition assessments. Essentially, they’re a type of environmental math that DCQ will conduct to compare the change in land condition over time. The team is trying to understand the proportion of perennial, annual and forb grasses, as well as leaf litter and bare ground, that make up the assessment. And they also consider other factors, like the amount of dead logs and woody debris on the site.
JANA: Between metre 75 and between metre 25, so that’s 50 metres of the transect, and on 10 metres each side we’re just counting how many meters of woody debris we have. But it needs to be something which is touching the ground and it’s larger than half a metre and thicker than 10 centimetres in diametre. So that’s what we’re going to do next.
CRISPIAN: And are we counting the woody debris for a particular purpose?
JANA: Yes, because that is part of the scoring for the whole calculation. The amount of how many rocks you have, how much woody debris, or how many perennial grasses, they all have different scoring and weighting in that whole calculation. And that gives you the basically the score for the site. So the more perennial grasses you have, obviously the better. The more woody debris you have the worse, because that doesn’t allow you to yeah. It’s for erosion for example. It’s got different score numbers.
MARIA: Having these kind of debris like the big trees debris, either they died from natural causes so you may have a more old forest for example and they are habitat for different animals there is also organic material in the composition that is going to come back to the ground so the debris means several things in nature.
CRISPIAN: The final part of the biocondition assessment is counting the different species of grasses and woody vegetation that are at the site.
JANA: We’re gonna have a look, so the whole transect from zero metre until 100 metres. We’re gonna see how many tree types we have here, and then we’re gonna see how high they are, and which one is the dominant layer.
CRISPIAN: Finally, all the data is collected and it’s time to make the final calculations.
The DCQ team will combine the scores and come up with an overall land condition, which is then provided to landholders to inform their operation and land management.
The ‘biocondition assessment’
To conduct an assessment, our teams navigate to the site (marked on a map app) and measure a 100m straight line between two points, called a ‘transect’.
Each point is marked with a metal stake to ensure consistency.
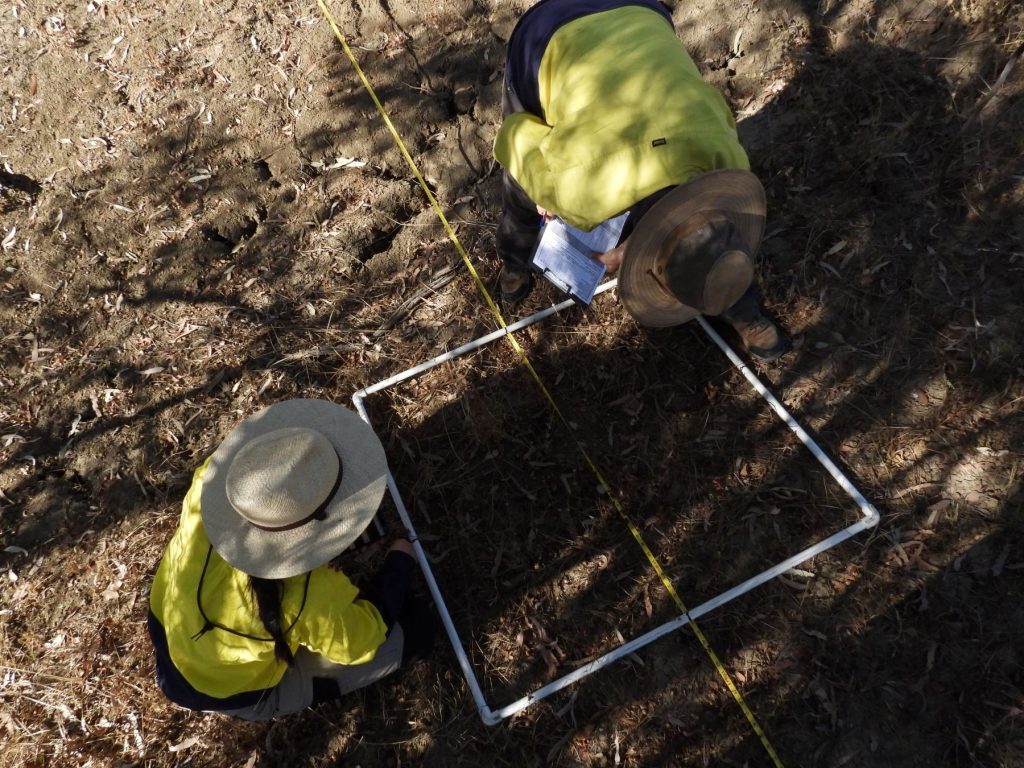
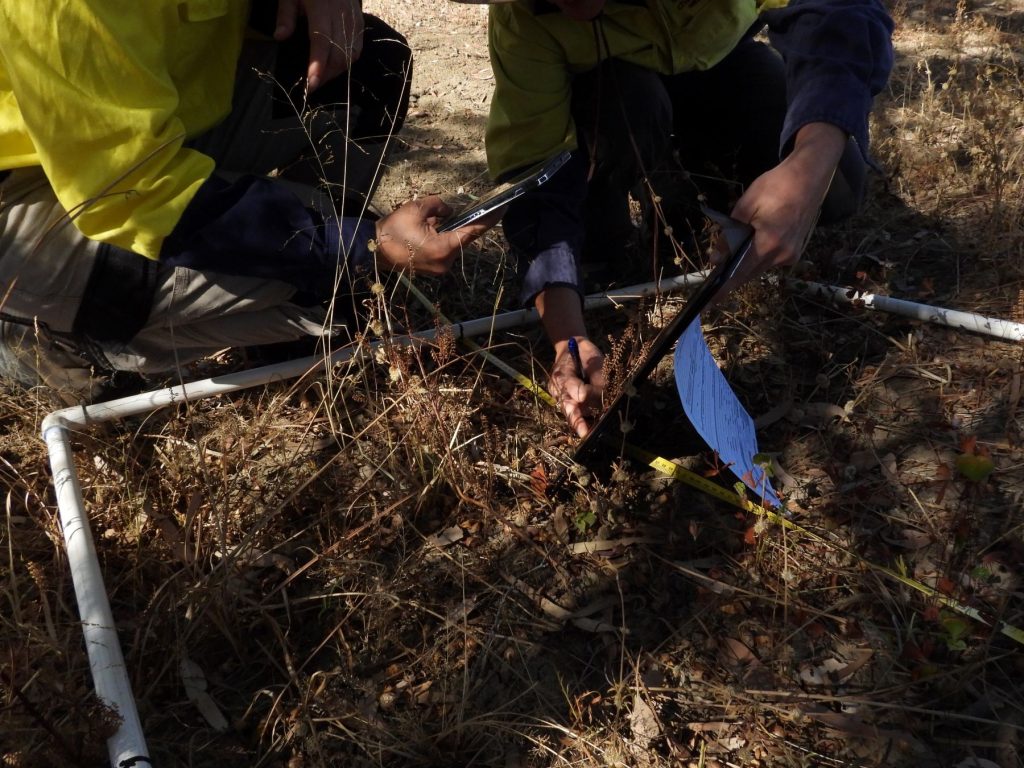
NRM Officers Jana Sykorova and Maria Vega inspect the biocondition of a quadrat near Darr River, 5 November 2025. (Photo by Crispian Yeomans)
We then lay a 1m by 1m poly-pipe square at precise intervals along the tape measure and begin to do ‘environmental maths’.
Essentially, staff will calculate the percentage of grasscover (forbs, perennials, annuals), biocrust, leaf litter, stoney cover and bare soil within the quadrant.
DCQ NRM Officer Jana Sykorova explained that the poly-pipe square helped make calculating the percentage easier.
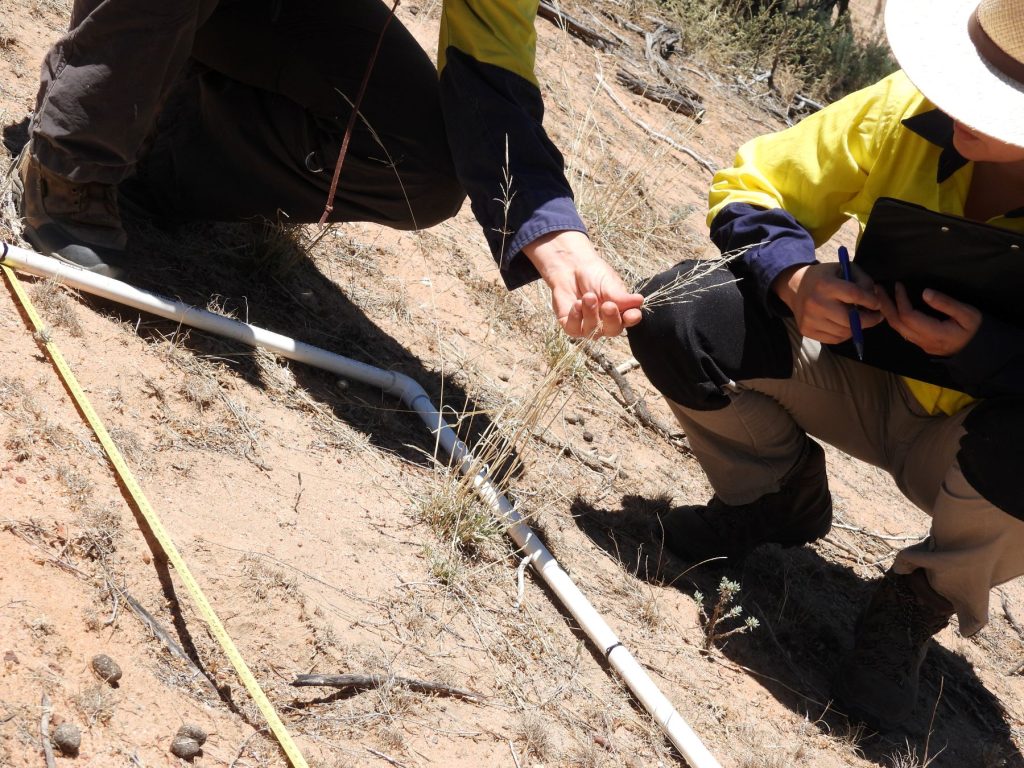
Perennial grasses are highly-valued in biocondition assessments, along with forbs and species diversity, 5 November 2025. (Photo by Crispian Yeomans)
“You split it into smaller quadrats, and then you try to visualise,” she said.
“If we put all the, let’s say, perennial grasses into the corner, would it fill 25 per cent or you know 12.5 per cent?
“So this is how we’re trying to judge what’s the percentage.”
The same technique is used on low-condition sites (like this one) and high-condition sites to get a precise measurement of biocondition, 5 November 2025. (Photo by Crispian Yeomans)
But that’s not all. Staff will also count the number of different grasses, weeds, shrubs and tree species across the length of the transect to identify the overall biodiversity of the site.
Finally, staff count the number of large trees, measure the canopy height and measure the size of woody debris (e.g. dead tree trunks, etc) up to 50 metres either side of the site.
NRM Officer Maria Vega has completed studies in soil science and explains why even fallen trees are considered in overall biocondition.
“The debris means several things in nature,” she said.
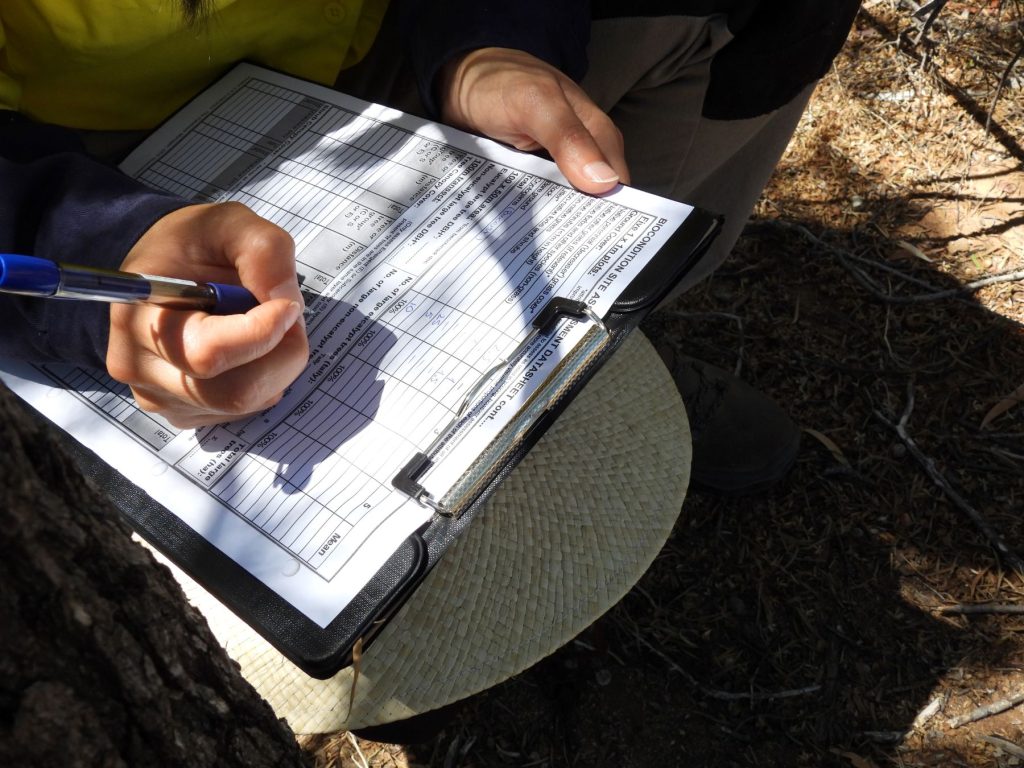
The small assessments will fill up a large data sheets that will be used for the overall “environmental calculation”, 5 November 2025. (Photo by Crispian Yeomans.)
“For the big tree debris, it may have died from natural causes and become habitat for different animals.
“There is also organic material in the composition that will return into the ground and improve the soil quality over time.”
All this data is then weighted (depending on significance) and combined to get an overall biocondition score.
All because of a square!
So if you ever see a DCQ staff member carrying around a square – now you know why!
Our staff have become very experienced at assessing land condition and can often tell from a glance the overall health of any given site, and how it’s been impacted by recent seasons.
A site with greater biodiversity, including several species of grasses and forbs that are recorded in the assessment, 5 November 2025. (Photo by Crispian Yeomans)
These biocondition assessments, and other monitoring tools, allow us to quantify these results and show with high-confidence the impact of these projects.
These trends are then provided to landholders, who will often use these data trends to inform operations and land management decisions long into the future.
Find out more about the Darr River cactus project here.
